Willem Alexanderplaats 88, 3223 XW Hellevoetsluis | +31 (0)181 314 405


LOCATION INTELLIGENCE
Location Intelligence projects, carried out for logistics services providers and shippers, aim to analyse and restructure distribution networks. Goal is to improve efficiency in the Supply Chain, to reduce distances and adapt to changing market conditions. Re-allocation of service engineers and allocation of customers to dropboxes or pudo's are among the possibilities.
Scroll down to find examples of Location Intelligence projects.
Picture shows a cluster iteration, 6 depots , clusters weighted by # shipments, new cluster centres are color coded, the existing depots show in green.
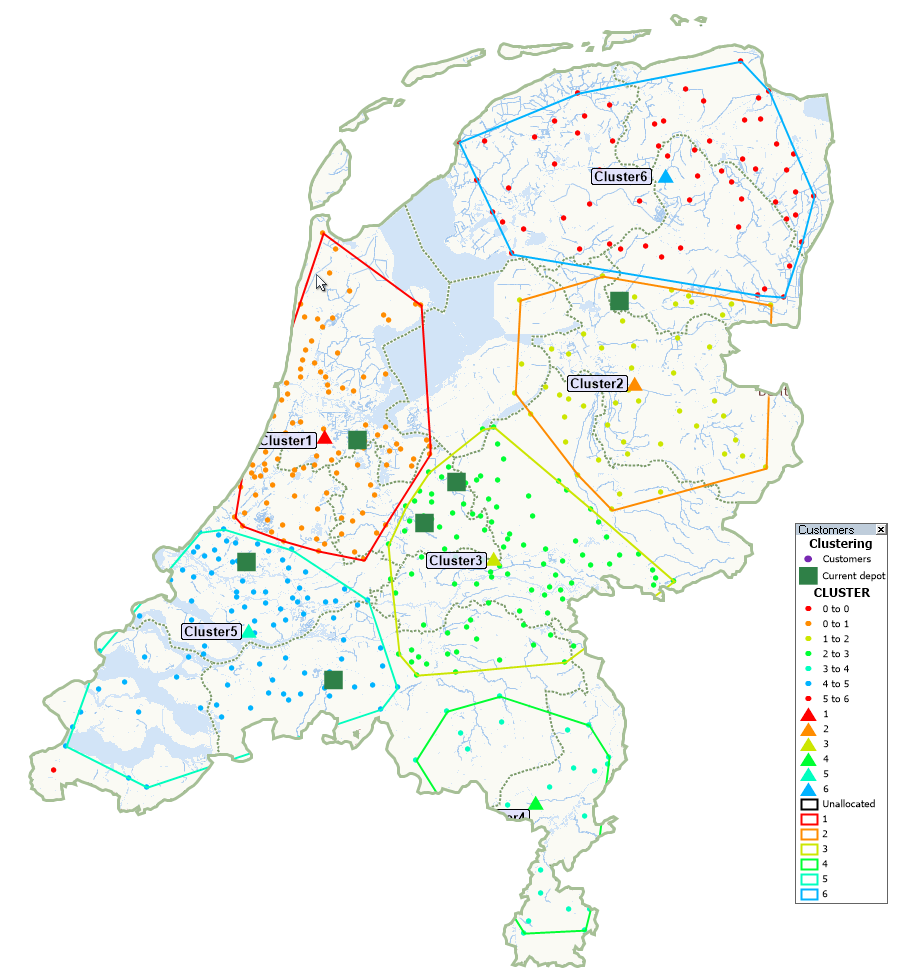
Picture shows a cluster iteration, 6 depots , clusters weighted by # shipments, new cluster centres are color coded, the existing depots show in green.

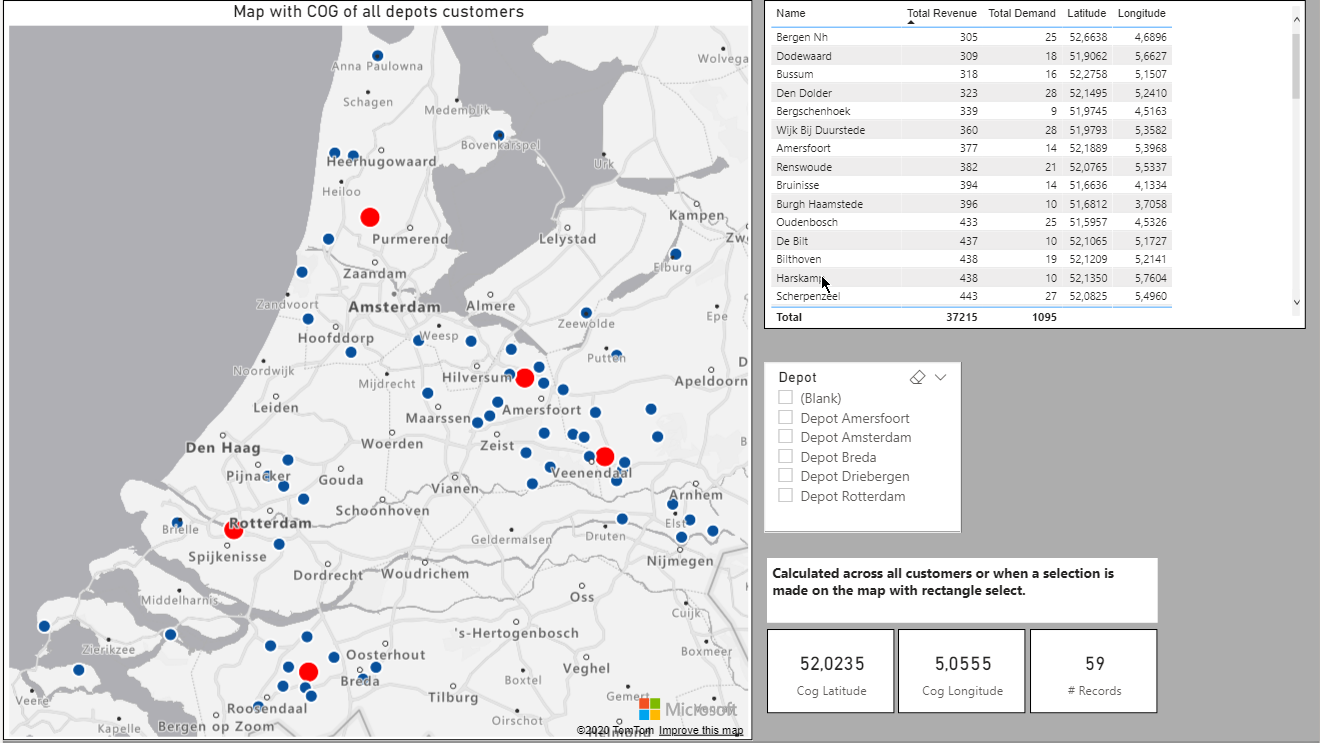
The data resulting from a final clustering run are used in a Power BI dashboard to further analyse and visualise the network.

After the clustering iterations, route simulation and optimisation can be executed, here with OptimoRoute (SaaS) routing software.
Two videos to show the application of GIS data in dynamic Power BI dashboards.

This map shows the distance to the nearest postcodes from existing depots in a color theme, in 10 km increments.
The "web", a Thiessen polygon, serves to visualise area distribution between depots. The lines split up areas so that the distance from a line between adjacent depots is the same.

Batch distance calculation, here between collection address and the 3 nearest depots allows to quickly analyse network structures.