Willem Alexanderplaats 88, 3223 XW Hellevoetsluis | +31 (0)181 314 405


POWER BI
Microsoft Power BI is the software we use to analyse and visualise big data. Today, a huge amount of data is available, from multiple sources, in the logistics sector for example
from TMS and WMS systems, and we assist to disclose significant, previously unknown information from your data.
Scroll down to find examples of Power BI dashboards.


3D modelling in Power BI allows to analyse and visualise your warehouse activities, offering a new perspective on the kpi's.

In this model an analysis of the effects of Brexit on revenue and costs, by customer. By changing parameters for Revenue, Seafreight, UK haulage, Cont.haulage and Trailer rent (days) the user is able to perform dynamic scenario analysis. Parameters and scenario analysis are powerful tools in Power BI.
3D modelling in Power BI allows to analyse and visualise your warehouse activities, offering a new perspective on the kpi's.

Example dashboard to analyse the "catch area" and associated data of a pudo after selecting a distance compared with the current area distribution in a separate map.
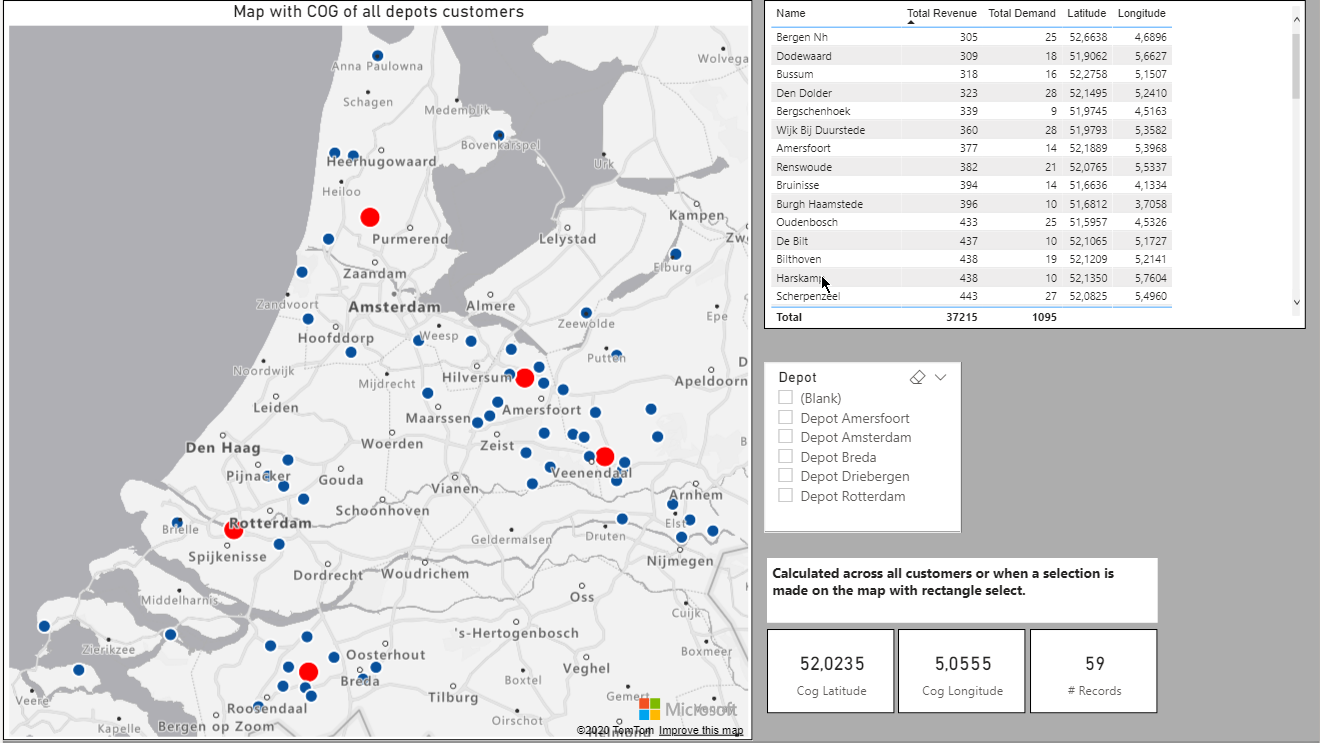
In this study, we are displaying the COG for multiple customer locations on the map.

In this study, a Huff gravity analysis for 5 stores in The Netherlands. In a second model we have incorporated surface adjustment and distance-decay.

Study to use Well Know Text to display data from a Transport Management System for further analysis.

Example dashboard to analyse the "catch area" and associated data of a pudo, given a selectable distance.
Power BI dashboard showing a dynamic analysis of data prepared in GIS software.